Give feedback and evaluate by understanding how money is spent
OpenSpending
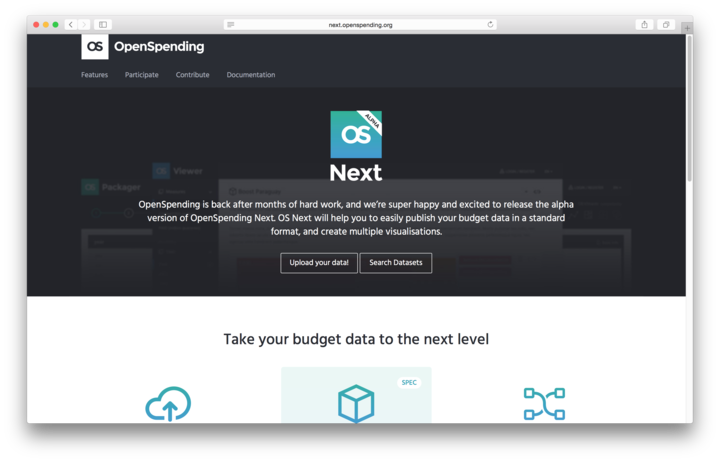
Open Spending allows you to understand how different organisations spend money. You can search existing data, upload your own and the programme provides visualisations to make finance easier to understand.
Participants
Unlimited.
Preparations
Web login. Prepare data in a CSV format.
Difficulty
Medium. Easy if you're an Accountant.

What is it and why should I use it?
The OpenSpending project is community-owned and community-run database and solution for exploring data, visualising it and getting involved with your community. Upload any kind of financial data to OpenSpending and explore it with their built-in interactive visualisations. Users are invited to get involved in loading data, developing the technology, doing analysis or writing news stories.
How do I use it?
- Search for existing data sets
- Upload your own data set
- Model your data - so it can work with the visualisation software
- Visualise the data - Treemaps, pie charts, bar charts, geolocation, line charts, tables, you name it!
- Share and embed - any visualisation into your website, blog…
Financial data isn't always fun, that's why the visualisation tools are so important. What's not to like about a bubble tree?
Resources & Links
Data uploaded and visualized on OpenSpending was shared with the community’s leaders for review. This gave the community the opportunity to compare and contrast how planned budget allocation matched up with how funds were actually spent. The community leaders identified potential misuse of funds in some budgets lines and are continuing to conduct investigations and collect evidence to expose poor management of public finances in Kota Damansara, Malaysia.
